GPS Data Parser– Processing Examples
This page shows some GPS data processing examples achieved after conversion of GPS receiver output data by means of the ´GPS Data Parser Program´ and subsequent visualisation of the processing results in Google Earth® or MS Excel®.
Table of Contents
1. Speed Boat Ride
3. Car Ride
Fly along a car track using the GOOGLE Earth tool 'Play Tour'
4. Passenger Flight from Portugal to the U.K.
3D Landing Track on Google Earth
Altitude Diagram Produced by MS Excel
5. Flight from the U.K. to Mexico
Track To and Fro on Google Earth
Altitude Diagram Produced by MS Excel
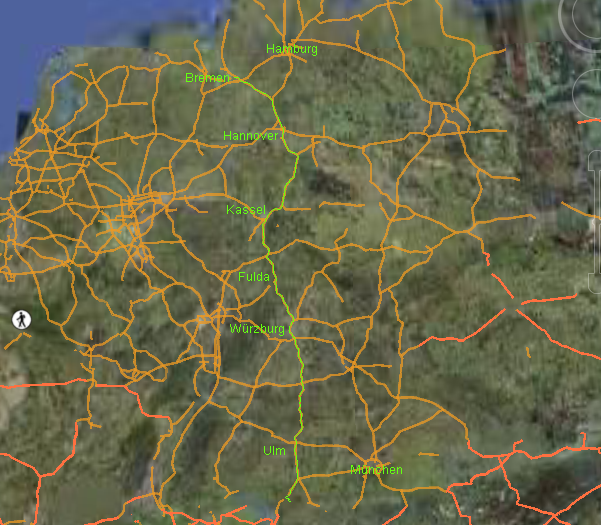
6. Car Trip from North to South Germany
Track recorded by Medion GoPal ® Car Navigator
GPS Altitude as a Function of Distance Driven
Speed as a Function of Distance Driven
Statistical Frequency of Speed Ranges
1. Speed Boat Ride
1.1 Track Plot on Google Earth
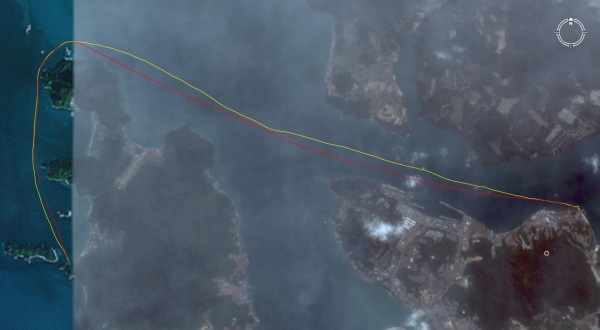
Table of Contents
1.2 Speed over Time Diagram Produced by MS Excel
Table of Contents
2. Glider Plane
2.1 3D Track View on Google Earth
Table of Contents
2.2 Altitude Diagram Produced by MS Excel
Table of Contents
3. Car Ride
3.1 Fly along a car track using the GOOGLE Earth tool 'Play Tour'.
If the video is not displayed, your browser may not support HTML5 video code.
Table of Contents
4. Passenger Flight from Portugal to the U.K.
4.1 Track View on Google Earth
Table of Contents
4.2 3D Landing Track on Google Earth
Table of Contents
4.3 Altitude Diagram Produced by MS Excel
Table of Contents
5. Flight from the U.K. to Mexico
5.1 Track To and Fro on Google Earth
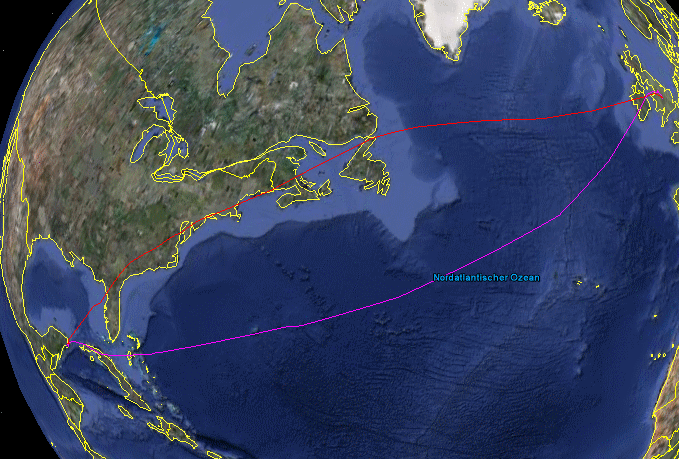
Table of Contents
5.2 Altitude Diagram Produced by MS Excel
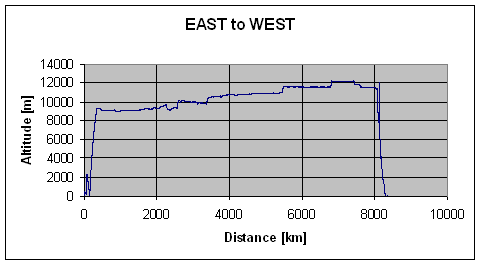
Table of Contents
5.3 Stopover in Manchester
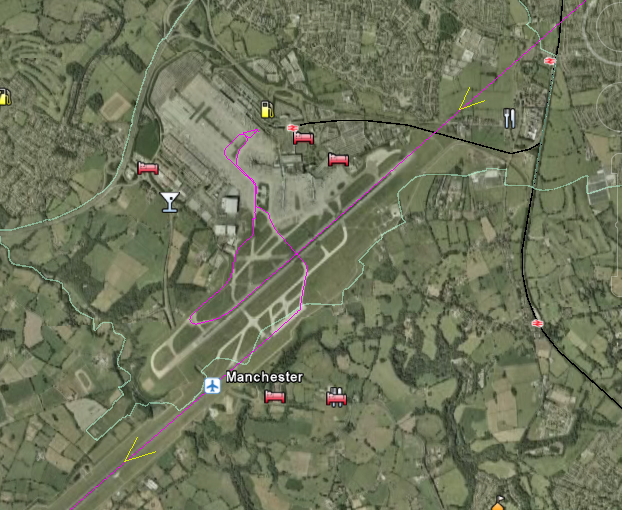
Table of Contents
6. Car Trip from North to South Germany
6.1 Track recorded by Medion GoPal ® Car Navigator
6.2 A Few Evaluations of the Track Data Table using MS Exel
6.2.1 GPS Altitude as a Function of Distance Driven
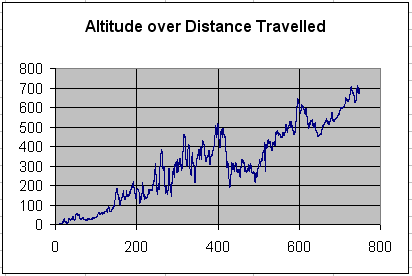
Table of Contents
6.2.2 Speed as a Function of Distance Driven
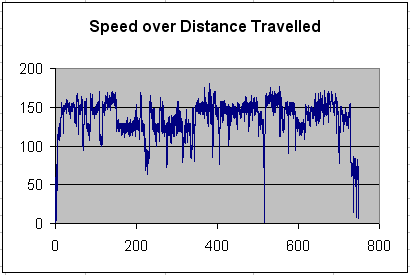
Table of Contents
6.2.3 Statistical Frequency of Speed Ranges
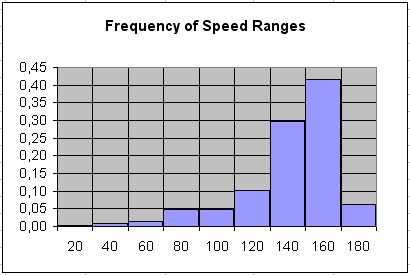
Table of Contents
6.2.4 Cumulative Speed Distribution
25% Quantile: < 121.65 kph, 50% Quantile: < 138.06 kph, 75% Quantile: < 149.62 kph (of time driven)
Driving time: 5h 43 min, Total distance: 748 km, Average speed: 130 kph.
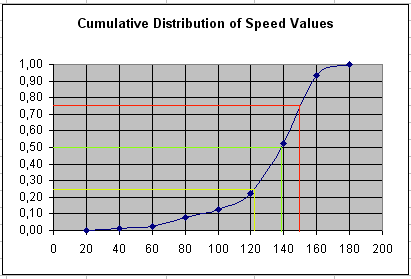
Table of Contents
Ingo Harre, Bremen, Germany, Content last modified on 2009/04/25